
TL;DR
- 🍳 You can write a CLI with ease. It's simpler than you might think:)
- 🗼 We'll write a CLI together to generate a Lighthouse performance report.
- 🔦 You'll see how to configure TypeScript, ESLint, and Prettier.
- 📚 You'll see how to use some awesome libraries like
chalkandcommander. - 🔬 You'll see how to spawn multiple processes.
- 🚀 You'll see how to use your CLI in GitHub Actions.
Writing CLIs feels like a super power, and you can write one too💯
I'll show you how to develop a CLI with TypeScript step by step and demonstrate how you can apply your CLI in CD/CI pipelines.
This article covers three major topics:
- Setting up A TypeScript Project with ESLint and Prettier
- Writing a CLI to Run Lighthouse in Multiple Process
- Using the CLI in Action with GitHub Actions
Feel free to jump to the parts that you're interested in.
Real-world Use Case
Lighthouse is one of the most popular dev tools to gain insight to webpage performances. It offers a CLI and node module so we can run it programmatically. However, you'll notice the Lighthouse scores vary if you run it multiple times on the same webpage. That's because there's a known variability. There're many factors that plays into the Lighthouse variability. One of the recommended strategies to deal with variance is to run Lighthouse multiple times.
We'll be working on a CLI to implement this strategy in this article. The implementation will cover:
- Running multiple Lighthouse analyses
- Aggregating data and calculating the median scores
I hope you're excited!
This article will discuss one of the scripts in 🌈🌈🌈 **dx-scripts**🌈🌈🌈
It's available on npm. I recently wrote the first script in the library and there are more to come! Feel free to install it and try it in your development workflow. Please give it a ️ on GitHub if the scripts are useful:)
Peaking The Project's File Structure
This is how the file structure will look like after configuring the tooling.
my-script
├── .eslintrc.js
├── .prettierrc.json
├── package.json
├── tsconfig.json
├── bin
└── src
    ├── utils.ts
    └── index.ts
The source files are located in the /src directory.
We'll compile them and output .js files in /bin directory.
The /bin directory will be the entry point of the command when your users are using the CLI.
You'll learn how to configure it in a bit.
Configuring Tooling
We'll be using Yarn as our package manager for this project. Feel free to use npm if you prefer.
Let's initiate the project. We'll create a directory called my-script:
$ mkdir my-script && cd my-script
At the project root, let's create a package.json with Yarn:
$ yarn init
Configuring TypeScript
To install TypeScript and the types for NodeJS, run:
$ yarn add --dev typescript @types/node
Now we are ready to configure TypeScript in the project.
We can initiate a tsconfig.json with tsc:
$ npx tsc --init
In order to compile the TypeScript code and output the result to the /bin directory, we need to specify it in the compilerOptions in tsconfig.json.
// tsconfig.json

{
  "compilerOptions": {
+    "outDir": "./bin"
    /* rest of the default options */
  }
}
That's it! Let's test it.
At the project root, run the following command to create an index.ts file in /src.
$ mkdir src && touch src/index.ts
In index.ts, we'll put a simple console.log and run the TypeScript compiler to see if the compiled files are in the /bin directory.
// src/index.ts

console.log('Hello from my-script👋')
Add a script to compile TypeScript with tsc.
// package.json

+ "scripts": {
+   "tsc": "tsc"
+ }
Then run:
# compile `/src`
$ yarn tsc
You should see an index.js file in the /bin directory.
Let's execute the /bin directory from the project root,
$ node bin

# Hello from my-script 👋
Configuring ESLint
Now we ready for ESLint. We can go ahead and install it:
$ yarn add --dev eslint
ESLint is a very powerful linter. It doesn't come with TypeScript support so we'll install a TypeScript parser:
$ yarn add --dev @typescript-eslint/parser @typescript-eslint/eslint-plugin
We also installed the @typescript-eslint/eslint-plugin.
This is because we'll need it to extend the ESLint rules for TypeScript-specific features.
Let's configure eslint in the project. We'll create a .eslintrc.js at the project root:
touch .eslintrc.js
Inside .eslintrc.js, we can configure eslint as following:
// .eslintrc.js

module.exports = {
  parser: '@typescript-eslint/parser',
  plugins: ['@typescript-eslint'],
  extends: ['plugin:@typescript-eslint/recommended'],
}
To understand the configuration a little more, we first used @typescript-eslint/parser to enable ESLint's ability to understand TypeScript syntax.
Then we applied @typescript-eslint/eslint-plugin plugin to extend the rules.
Finally we enabled all the recommended rules form @typescript-eslint/eslint-plugin.
If you're interested in learning more about the configuration, you can checkout the official doc for more details.
We can now add a linting script to package.json:
// package.json

{
  "scripts": {
+    "lint": "eslint '**/*.{js,ts}' --fix",
  }
}
To run the script:
$ yarn lint
Configuring Prettier
Prettier is a very powerful formatter. It comes with a set of rules to format our code. Sometimes the rules can conflict with ESLint rules so I'll show you how to configure them.
First install Prettier and create a .prettierrc.json file at the project root to hold the configuration,
$ yarn add --dev --exact prettier && touch .prettierrc.json
You can edit .prettierrc.json and add your custom rules.
You can find the options in the official doc.
Here's an example:
// .prettierrc.json
{
  "trailingComma": "all",
  "singleQuote": true
}
Prettier provides handy integration with ESLint. We'll follow the recommended configuration from the official doc.
$ yarn add --dev eslint-config-prettier eslint-plugin-prettier
We'll add the plugin at the last position in the extensions array.
// .eslintrc.js

module.exports = {
  extends: [
    'plugin:@typescript-eslint/recommended',
+    'plugin:prettier/recommended',
  ],
}
It's very important that Prettier is the last extension. By applying last, it disables all formatting-related ESLint rules so the conflicts will fall back to Prettier.
We can now add a prettier script to package.json:
// package.json

{
  "scripts": {
+    "prettier": "prettier --write ."
  }
}
To run the script:
$ yarn prettier
Configuring package.json
We are almost ready with our configuration.
The only thing missing is a way to execute the project the way you would execute a command.
Instead of executing the /bin with node, we want to be able to call the command directly:
# instead of "node bin", we want to call the command by its name like this:
$ my-script
How do we do that? First we need to add a Shebang on the top of our src/index.ts.
+ #!/usr/bin/env node

console.log('Hello from my-script👋')
The Shebang is to inform Unix-like operating systems that this is NodeJS executable.
So we can call the script directly without specifying node.
Let's compile again,
$ yarn tsc
There's another thing we need before it all works. We need to assign the executable right to the bin/index.js:
$ chmod u+x ./bin/index.js
Let's give it a go:
# execute directly
$ ./bin/index.js

# Hello from my-script👋
Nice, we are almost there.
The last thing is to create a symlink between the command and the executable.
First, we need to specify the bin property in package.json and point the command to the bin/index.js.
// package.json

{
+  "bin": {
+    "my-script": "./bin/index.js"
+  }
}
Second, create a symlink with Yarn at the project root:
$ yarn link

# You can always unlink: "yarn unlink my-script"
Let's see if it works
$ my-script

# Hello from my-script👋
It works🎉🎉🎉
Just to make the development easier, we'll add a couple of scripts in package.json:
// package.json

{
  "scripts": {
+    "build": "yarn tsc && yarn chmod",
+    "chmod": "chmod u+x ./bin/index.js",
  }
}
Now we can run yarn build to compile and automatically assign the executable right to the entry file.
Writing a CLI to Run Lighthouse
It's time to implement our core logic. We'll explore a few handy npm packages to help us write the CLI and we'll dive into the magic of Lighthouse.
Coloring console.log with chalk
$ yarn add chalk@4.1.2
Make sure you are installing chalk 4. chalk 5 is pure ESM and we won't be able to use it with TypeScript until TypeScript 4.6 is released.
chalk gives colors to your console.log. For example:
// src/index.ts

import chalk from 'chalk'

console.log(chalk.green('Hello from my-script👋'))
Now run yarn build && my-script at your project root and see the log.
Let's use chalk in a more meaningful way.
Lighthouse performane scores are color coded.
We can write a utility function that shows the display value with a color based on the performance score.
// src/utils.ts

import chalk from 'chalk'

/**
 * Coloring display value based on Lighthouse score.
 *
 * - 0 to 0.49 (red): Poor
 * - 0.5 to 0.89 (orange): Needs Improvement
 * - 0.9 to 1 (green): Good
 */
export function draw(score: number, value: number) {
  if (score >= 0.9 && score <= 1) {
    return chalk.green(`${value} (Good)`)
  }

  if (score >= 0.5 && score < 0.9) {
    return chalk.yellow(`${value} (Needs Improvement)`)
  }

  return chalk.red(`${value} (Poor)`)
}
Use it in src/index.ts and try log something with draw() to see the result.
// src/index.ts

import { draw } from './utils'

console.log(`Perf score is ${draw(0.64, 64)}`)
Designing A Command with commander
To make our CLI interactive, we need to be able to read user inputs and parse them.
commander is a descriptive way of defining a interface.
We can implement our interface in a very clean and documentary fashion.
How do we want the users to interact with the CLI is to simply pass a URL for Lighthouse to run. We also want to pass in an option to specify how many times Lighthouse should run on the URL. Like this:
# without an option
$ my-script https://dawchihliou.github.io/

# with an option
$ my-script https://dawchihliou.github.io/ --iteration=3
Let's see how quickly we can implement our design with commander.
$ yarn add commander
Let's clear the src/index.ts and start fresh:
src/index.ts
#!/usr/bin/env node

import { Command } from 'commander'

async function run() {
  const program = new Command()

  program
    .argument('<url>', 'Lighthouse will run the analysis on the URL.')
    .option(
      '-i, --iteration <type>',
      'How many times Lighthouse should run the analysis per URL',
      '5'
    )
    .parse()

  const [url] = program.args
  const options = program.opts()

  console.log(`url: ${url}, iteration: ${options.iteration}`)
}

run()
We first instantiated a Command and we used the instance program to define:
- an
required argument: we gave it a nameurland a description - an
option: we gave it a short flag and a long flag, a description, and a default value
To consume the argument and option, we first parse the command and log the variables.
Now we can run the command and observe the log.
$ yarn build

# without an option
$ my-script https://dawchihliou.github.io/

# url: https://dawchihliou.github.io/, iteration: 5

# with an option
$ my-script https://dawchihliou.github.io/ --iteration=3
# or
$ my-script https://dawchihliou.github.io/ -i 3

# url: https://dawchihliou.github.io/, iteration: 3
Very cool right?!
Another cool feature is that commander automatically generates a help to print the help information.
$ my-script --help
Running Multiple Lighthouse Analyses in Separate OS Processes
We learned how to parse user inputs in the previous section. It's time to dive into the core of the CLI.
The recommendation for running multiple Lighthouse is to run them in separate processes to remove the risk of interference.
cross-spawn is a cross platform solution for spawning processes.
We will use it to synchronously spawn new processes to run Lighthouse.
To install cross-spawn:
$ yarn add cross-spawn
$ yarn add --dev @types/cross-spawn

# Let's install lighthouse too✨
yarn add lighthouse
Let's edit src/index.ts:
import { Command } from 'commander'
+ import spawn from 'cross-spawn'

+ const lighthouse = require.resolve('lighthouse/lighthouse-cli')

async function run() {
  // ...
-  console.log(`url: ${url}, iteration: ${options.iteration}`)
+  console.log(
+    `🗼 Running Lighthouse for ${url}. It will take a while, please wait...`
+  )
+  const results = []
+
+  for (let i = 0; i < options.iteration; i++) {
+    const { status, stdout } = spawn.sync(
+      process.execPath, [
+      lighthouse,
+      url,
+      '--output=json',
+      '--chromeFlags=--headless',
+      '--only-categories=performance',
+    ])
+
+    if (status !== 0) {
+      continue
+    }
+
+    results.push(JSON.parse(stdout.toString()))
+  }
}
In the code, we spawn new processes multiple times based on user input.
In each process, we ran Lighthouse performance analysis with headless Chrome and collect the the JSON data.
The result variable will hold an array of independent performance data in string.
The next step is to aggregate the data and calculate the most reliable performance scores.
If you implement the code above, you'll see a linting error about require.
require.resolve resolves the path to a module instead of the module itself.
In this article, we'll allow the @typescript-eslint/no-var-requires rule in .eslintrc.js to compile.
// .eslintrc.js

module.exports = {
+  rules: {
+    // allow require
+    '@typescript-eslint/no-var-requires': 0,
+  },
}
Calculating Reliable Lighthouse Scores
One strategy is to aggregate the reports by calculating the median.
Lighthouse provide a internal functionality computeMedianRun.
Let's use it
// src/index.ts

+ // For simplicity, we use require here because lighthouse doesn't provide type declaration.
+ const {
+   computeMedianRun,
+ } = require('lighthouse/lighthouse-core/lib/median-run.js')

async function run() {
  // ...
+   const median = computeMedianRun(results)

+   console.log(`\n${chalk.green('✔')} Report is ready for ${median.finalUrl}`)
+   console.log(
+     `🗼 Median performance score: ${draw(
+       median.categories.performance.score,
+       median.categories.performance.score * 100
+     )}`
+   )

+   const primaryMatrices = [
+     'first-contentful-paint',
+     'interactive',
+     'speed-index',
+     'total-blocking-time',
+     'largest-contentful-paint',
+     'cumulative-layout-shift',
+   ]
+
+   primaryMatrices.map((matrix) => {
+     const { title, displayValue, score } = median.audits[matrix]
+     console.log(`🗼 Median ${title}: ${draw(score, displayValue)}`)
+   })
}
Under the hood, computeMedianRun returns the score that's closest to the median of the First Contentful Paint and the median of the Time to Interactive.
It's because they represent the earliest and the latest moments in the page initialization lifecycle.
It's a more reliable way to determine the median than the naive approach by finding the median from a single measurement.
Now try the command again and see the result!
$ yarn build && my-script https://dawchihliou.github.io --iteration=3
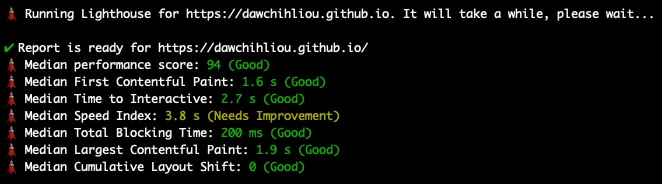
Walla🎉
Using the CLI in GitHub Actions
Our implementation is done. Let's use the CLI in an automated workflow so we can benchmark the performance in a CD/CI pipeline.
First, let's publish the package on npm (hypothetically).
I published a npm package dx-scripts that includes the production-ready version of my-script.
We will write the GitHub Actions workflow with dx-scripts to illustrate.
Publishing on npm (an example)
We'll add a files property in package.json to publish the /bin directory.
// package.json

{
+  "files": ["bin"],
}
Then simply run:
$ yarn publish
Now the package is on npm (hypothetically)!
Writing A Workflow
Let's discuss the workflow. We want the workflow to:
- run on a pull request when there's an update
- run the Lighthouse performance analysis against a feature branch preview URL
- notify the pull request with the analysis report
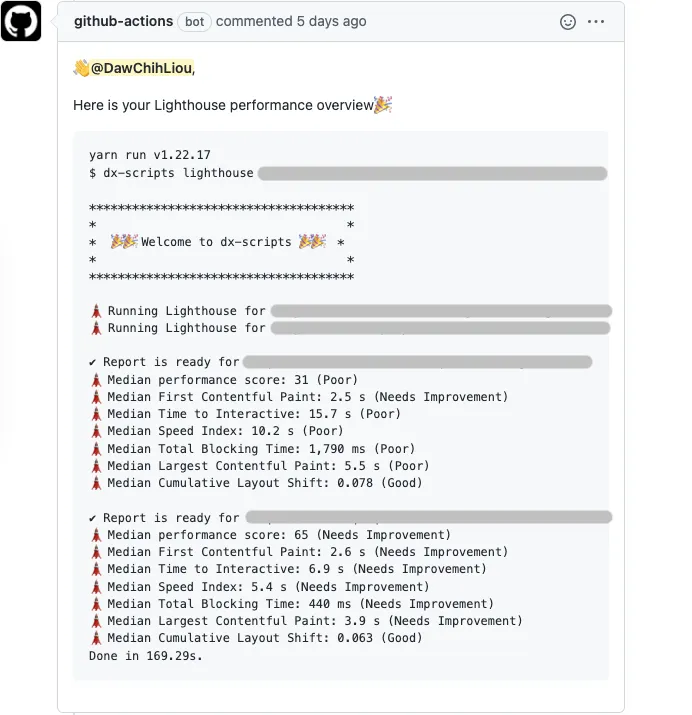
So after the workflow is successfully completed, you'll see a comment from GitHub Action Bot with your Lighthouse scores.
To focus on the application of our CLI, I'll hard-code the feature branch preview URL in the workflow.
In your application repository, install dx-scripts:
$ yarn add --dev dx-scripts
Add a lighthouse-dev-ci.yaml to your GitHub workflows directory:
# .github/workflows/lighthouse-dev-ci.yaml

name: Lighthouse CI

on: pull_request

jobs:
  lighthouse:
    runs-on: ubuntu-latest
    env:
      # You can substitute the hardcoded preview url with your preview url
      preview_url: https://dawchihliou.github.io/
    steps:
      - uses: actions/checkout@v2

      - uses: actions/setup-node@v1
        with:
          node-version: '16.x'

      - name: Install dependencies
        run: yarn

      # You can add your steps here to create a preview

      - name: Run Lighthouse
        id: lighthouse
        shell: bash
        run: |
          lighthouse=$(npx dx-scripts lighthouse $preview_url)
          lighthouse="${lighthouse//'%'/'%25'}"
          lighthouse="${lighthouse//$'\n'/'%0A'}"
          lighthouse="${lighthouse//$'\r'/'%0D'}"
          echo "::set-output name=lighthouse_report::$lighthouse"

      - name: Notify PR
        uses: wow-actions/auto-comment@v1
        with:
          GITHUB_TOKEN: ${{ secrets.GITHUB_TOKEN }}
          pullRequestSynchronize: |
            👋 @{{ author }},

            Here is your Lighthouse performance overview🎉

            ```
            ${{ steps.lighthouse.outputs.lighthouse_report }}
            ```
In the "Run Lighthouse" step, we ran the dx-script lighthouse CLI, substitute the special characters in order to print multi-line output, and we set the output in a variable lighthouse_report.
In the "Notify PR" step, we wrote a comment with the output from the "Run Lighthouse" step and use the wow-actions/auto-comment action to post the comment.
That's it! What a journey. It's amazing that you followed all the way through.
To Sum up
Writing a CLI is not too hard, right?😎 Let's have a look at all the things we've covered:
- configuring TypeScript
- configuring ESLint
- configuring Prettier
- executing your command locally
- coloring logs with
chalk - defining your command with
commander - spawning processes
- executing Lighthouse CLI
- using Lighthouse's internal library to calculate median performance scores
- publish your command as a npm package
- applying your command to a GitHub Action workflow
Now the super power is yours too🚀
Here you have it! I hope you find it useful. Thanks for reading through🙌
Please share this article so that more people who're looking for inspirations can see it.
Feel free to connect with me on twitter!
If you're interested in reading more about image optimization to boost your performance score, take a look at my previous article "Using WebP for Better User Experience". There we discussed one of the modern image formats that greatly reduces the size of your images without sacrificing quality.
If you're wondering how to test Redux Observable, I wrote an article "Writing Better Marble Tests for Redux Observable and TypeScript" just for you. It's a comprehensive guide to walk you through the thought process.
If you’re a fan of functional programming, check out this article that I wrote about Transducers. It’s a step by step reasoning on writing a transducer and it touches on key ideas about functional programming.
Happy coding!